The month of August when global markets are usually calm have set a president of what is about to come around the world. I want to give you a full global analysis over what has happened the last month in the world economy and what might be coming soon?
First let’s take a look at what have happened in the economy in the month of August:
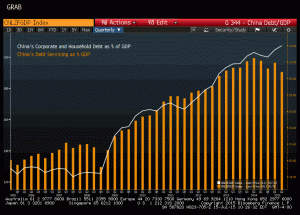
China’s currency devaluation and other countries doing the same erupting a currency war 2.0. Let us take a look at how the shot across the bow to the US Dollar’s world reserve currency status. While China devalued their currency and have had a massive stock market and real estate market crash as their debt bubble is deflating they have thrown all the money they can to keep the bubble from deflating in a natural pace, usually it should drop 30-70% depending of the leverage. The Chinese debt to GDP is now at a record 207% to GDP. This is up from the 2008 number of 125% to GDP in the private sector. This is almost an increase of 100% in only 7 years a massive increase in debt.
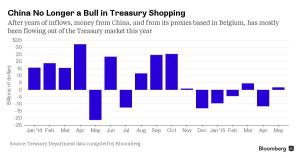
As China wants to keep it’s economy afloat it has done a lot of invasion of it’s economy by halting trading on 80% of it’s stocks traded on the stock exchange, but most important of all it started selling something that might change the world forever. China started tapping into it’s foreign exchange rates by selling US Bonds!!!!! The biggest buyer of US debt that helped the US government keep borrowing money has now turned around and started selling the US debt and this might start an cascading event of selling by others holding the US debt.
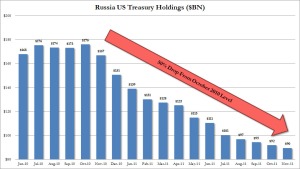
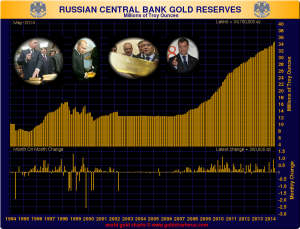
I predict more US debt being sold and US dollars might flood the US economy. Where it will go and what assets or commodities it might inflate is yet unknown, but this is one of the final signs of the demise of the US dollar. Russia as shown above has been trying to get rid of US treasuries for a while already and has been buying gold instead.
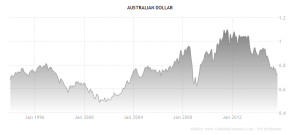
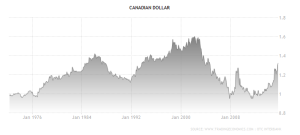
Lets take a look at the recent currency devaluation from China and what has followed. There has as of lately been an enormous volatility in currencies as countries believe that by devaluing their currency their economies strengthen. Here are the last number on currencies to US dollar valuation over the last month and year:
| World | Actual | Monthly | Yearly | Date |
| Canada | 1.3204 | 2.00% | 22.30% | 28-Aug |
| Mexico | 16.7551 | 2.80% | 27.80% | 28-Aug |
| Brazil | 3.5835 | 7.70% | 59.30% | 28-Aug |
| United States | 96.149 | -0.90% | 16.60% | 28-Aug |
| Argentina | 9.2933 | 1.40% | 10.60% | 28-Aug |
| Venezuela | 6.35 | 0.90% | 1.00% | 28-Aug |
| Colombia | 3,075.00 | 8.00% | 63.50% | 28-Aug |
| Chile | 691.995 | 4.00% | 17.40% | 28-Aug |
| Peru | 3.226 | 1.40% | 16.30% | 28-Aug |
| Cuba | 1 | 0.00% | 0.00% | 28-Aug |
| Dominican Republic | 45.04 | 0.40% | 3.40% | 28-Aug |
| Guatemala | 7.6795 | 0.10% | -1.20% | 28-Aug |
| Uruguay | 28.485 | 2.00% | 20.20% | 28-Aug |
| Costa Rica | 532.4 | -0.20% | 0.70% | 28-Aug |
| Panama | 1 | 2.40% | 2.00% | 28-Aug |
| Bolivia | 6.9 | 2.90% | 2.20% | 28-Aug |
| Paraguay | 5,367.24 | 5.10% | 28.80% | 28-Aug |
| El Salvador | 8.735 | 0.00% | -0.10% | 28-Aug |
| Trinidad and Tobago | 6.3538 | 0.20% | 0.40% | 28-Aug |
| Honduras | 21.9889 | 0.20% | 4.30% | 28-Aug |
| Jamaica | 117.41 | 0.30% | 4.30% | 28-Aug |
| Nicaragua | 27.4655 | 2.90% | 6.40% | 28-Aug |
| Haiti | 51.4462 | -8.30% | 16.40% | 28-Aug |
| Bahamas | 1 | 0.00% | 0.00% | 28-Aug |
| Suriname | 3.3 | 0.00% | 0.00% | 28-Aug |
| Guyana | 207.21 | 0.10% | 0.00% | 28-Aug |
| Cayman Islands | 0.82 | 0.00% | 0.00% | 28-Aug |
| Euro Area | 1.118 | 1.80% | -15.10% | 28-Aug |
| United Kingdom | 1.5391 | -1.40% | -7.20% | 28-Aug |
| Switzerland | 0.9629 | -0.50% | 5.30% | 28-Aug |
| Russia | 65.427 | 11.50% | 77.90% | 28-Aug |
| Turkey | 2.9239 | 6.00% | 35.80% | 28-Aug |
| Sweden | 8.4634 | -1.10% | 21.80% | 28-Aug |
| Poland | 3.7689 | 1.30% | 18.40% | 28-Aug |
| Norway | 8.2893 | 1.70% | 34.10% | 28-Aug |
| Denmark | 6.6755 | -1.00% | 18.20% | 28-Aug |
| Czech Republic | 24.1725 | -1.00% | 15.30% | 28-Aug |
| Romania | 3.9587 | -0.70% | 19.00% | 28-Aug |
| Hungary | 281.075 | -0.20% | 18.70% | 28-Aug |
| Ukraine | 21.2 | -2.80% | 54.70% | 28-Aug |
| Belarus | 17,552.50 | 15.30% | 68.40% | 28-Aug |
| Croatia | 6.7597 | -2.30% | 16.90% | 28-Aug |
| Bulgaria | 1.7456 | -1.20% | 17.70% | 28-Aug |
| Serbia | 107.52 | -0.60% | 21.10% | 28-Aug |
| Bosnia and Herzegovina | 1.7486 | -1.80% | 18.20% | 28-Aug |
| Iceland | 129.93 | -2.90% | 11.40% | 28-Aug |
| Albania | 123.8295 | -2.20% | 17.10% | 28-Aug |
| Macedonia | 54.83 | -0.90% | 18.40% | 28-Aug |
| Moldova | 19.05 | 2.40% | 39.80% | 28-Aug |
| Japan | 121.73 | -1.80% | 17.30% | 28-Aug |
| China | 6.3899 | 2.90% | 4.00% | 28-Aug |
| India | 66.1525 | 3.70% | 9.00% | 28-Aug |
| South Korea | 1,180.30 | 1.80% | 16.50% | 28-Aug |
| Indonesia | 14,110.50 | 6.20% | 21.00% | 28-Aug |
| Saudi Arabia | 3.7513 | 0.20% | 0.10% | 28-Aug |
| Taiwan | 32.356 | 2.50% | 11.10% | 28-Aug |
| Iran | 29,930.00 | 1.20% | 20.70% | 28-Aug |
| United Arab Emirates | 3.673 | 0.00% | 0.00% | 28-Aug |
| Thailand | 35.858 | 3.00% | 12.50% | 28-Aug |
| Malaysia | 4.172 | 9.80% | 32.90% | 28-Aug |
| Singapore | 1.4088 | 2.90% | 12.80% | 28-Aug |
| Israel | 3.9297 | 4.10% | 10.30% | 28-Aug |
| Hong Kong | 7.7516 | 0.00% | 0.00% | 28-Aug |
| Philippines | 46.7455 | 2.90% | 7.40% | 28-Aug |
| Pakistan | 103.905 | 2.20% | 4.20% | 28-Aug |
| Iraq | 1,146.00 | -3.70% | -1.40% | 28-Aug |
| Kazakhstan | 243.2099 | 31.80% | 35.40% | 28-Aug |
| Qatar | 3.6416 | 0.10% | 0.10% | 28-Aug |
| Vietnam | 22,462.50 | 4.70% | 7.60% | 28-Aug |
| Bangladesh | 77.851 | 2.30% | 2.20% | 28-Aug |
| Oman | 0.3853 | 0.40% | 0.40% | 28-Aug |
| Azerbaijan | 1.0503 | -0.20% | 34.70% | 28-Aug |
| Sri Lanka | 134.35 | 3.00% | 3.30% | 28-Aug |
| Syria | 220.25 | 0.60% | 43.40% | 27-Aug |
| Myanmar | 1,281.75 | 3.20% | 32.00% | 28-Aug |
| Uzbekistan | 2,595.52 | 0.80% | 11.90% | 28-Aug |
| Macao | 7.9826 | -0.10% | 0.00% | 28-Aug |
| Turkmenistan | 3.5 | 0.00% | 22.80% | 28-Aug |
| Lebanon | 1,506.50 | -0.10% | -0.40% | 28-Aug |
| Yemen | 214.89 | 0.00% | 0.00% | 28-Aug |
| Jordan | 0.7089 | 0.40% | 0.40% | 28-Aug |
| Bahrain | 0.3773 | 0.10% | 2.00% | 28-Aug |
| Afghanistan | 65.06 | 7.60% | 17.20% | 28-Aug |
| Nepal | 105.784 | 3.50% | 9.30% | 28-Aug |
| Brunei | 1.4089 | 3.10% | 13.60% | 28-Aug |
| Cambodia | 4,101.30 | 0.40% | 3.10% | 28-Aug |
| Georgia | 2.345 | 2.90% | 35.60% | 28-Aug |
| North Korea | 130.04 | 0.00% | -0.10% | 30-Jun |
| Mongolia | 1,991.00 | 0.50% | 9.50% | 28-Aug |
| Laos | 8,182.95 | 0.50% | 4.20% | 28-Aug |
| Armenia | 483.53 | 1.00% | 18.00% | 28-Aug |
| Tajikistan | 6.3198 | 1.00% | 25.40% | 28-Aug |
| Kyrgyzstan | 65.9956 | 8.30% | 24.60% | 28-Aug |
| Maldives | 15.36 | 0.70% | -0.20% | 28-Aug |
| Australia | 0.7165 | -1.80% | -23.40% | 28-Aug |
| New Zealand | 0.6463 | -3.10% | -22.90% | 28-Aug |
| Papua New Guinea | 2.8112 | 1.60% | 36.50% | 27-Aug |
| New Caledonia | 106.689 | -1.60% | 18.10% | 28-Aug |
| Fiji | 2.1565 | 1.10% | 15.90% | 28-Aug |
| Nigeria | 199.05 | 19805.00% | 24.70% | 28-Aug |
| South Africa | 13.313 | 6.10% | 25.50% | 28-Aug |
| Egypt | 7.8357 | 0.40% | 9.90% | 28-Aug |
| Algeria | 106.055 | 7.40% | 32.70% | 28-Aug |
| Angola | 125.65 | -0.20% | 28.70% | 28-Aug |
| Morocco | 9.7298 | -0.30% | 18.30% | 28-Aug |
| Sudan | 6.077 | 1.90% | 6.60% | 28-Aug |
| Kenya | 103.9295 | 3.40% | 19.60% | 28-Aug |
| Ethiopia | 20.8375 | 0.10% | 4.90% | 28-Aug |
| Tanzania | 2,140.00 | 4.50% | 31.40% | 28-Aug |
| Tunisia | 1.9591 | 0.30% | 13.20% | 28-Aug |
| Libya | 1.3664 | -0.50% | 12.90% | 28-Aug |
| Ghana | 4.03 | 10.10% | 6.50% | 28-Aug |
| Ivory Coast | 586.4614 | -1.80% | 17.80% | 28-Aug |
| Congo | 928 | 0.10% | 0.40% | 28-Aug |
| Cameroon | 584.866 | -1.60% | 17.50% | 27-Aug |
| Zambia | 8.46 | 10.90% | 41.00% | 27-Aug |
| Uganda | 3,630.00 | 6.60% | 38.60% | 28-Aug |
| Gabon | 584.866 | -1.60% | 17.50% | 27-Aug |
| Mozambique | 41.255 | 8.50% | 35.80% | 28-Aug |
| Botswana | 10.283 | 3.70% | 17.40% | 28-Aug |
| Senegal | 586.4614 | -1.80% | 17.80% | 28-Aug |
| Equatorial Guinea | 586.4614 | -1.80% | 17.80% | 28-Aug |
| Republic of the Congo | 584.866 | -1.60% | 17.50% | 27-Aug |
| Chad | 584.866 | -1.60% | 17.50% | 27-Aug |
| Namibia | 13.3045 | 5.90% | 27.20% | 28-Aug |
| South Sudan | 7.2 | 0.00% | 71.40% | 11-Mar |
| Mauritius | 35.18 | -0.50% | 13.10% | 28-Aug |
| Burkina Faso | 586.4614 | -1.80% | 17.80% | 28-Aug |
| Mali | 586.4614 | -1.80% | 17.80% | 28-Aug |
| Madagascar | 3,302.60 | -1.10% | 29.40% | 28-Aug |
| Benin | 586.4614 | -1.80% | 17.80% | 28-Aug |
| Niger | 586.4614 | -1.80% | 17.80% | 28-Aug |
| Rwanda | 729.3 | 7.30% | 7.50% | 28-Aug |
| Guinea | 7,250.35 | -3.80% | 3.10% | 28-Aug |
| Mauritania | 314 | -3.40% | 7.40% | 28-Aug |
| Sierra Leone | 4,640.00 | 18.10% | 6.10% | 28-Aug |
| Togo | 586.4614 | -1.80% | 17.80% | 28-Aug |
| Malawi | 556.185 | 20.80% | 40.60% | 28-Aug |
| Eritrea | 15.28 | 1.90% | 1.90% | 28-Aug |
| Swaziland | 13.3045 | 6.20% | 25.00% | 28-Aug |
| Burundi | 1,538.00 | -1.70% | -0.80% | 28-Aug |
| Lesotho | 13.3045 | 6.20% | 25.30% | 28-Aug |
| Liberia | 84.66 | 0.00% | 0.80% | 28-Aug |
| Cape Verde | 97.766 | -2.60% | 17.60% | 28-Aug |
| Central African Republic | 584.866 | -1.60% | 17.50% | 27-Aug |
| Djibouti | 177.67 | 0.60% | 0.80% | 28-Aug |
| Seychelles | 13.0405 | -2.60% | 0.50% | 28-Aug |
| Somalia | 658.5 | -1.50% | -16.00% | 28-Aug |
| Gambia | 39.6 | 0.90% | -0.10% | 28-Aug |
| Comoros | 439.846 | 0.50% | 21.10% | 28-Aug |
| Sao Tome and Principe | 21,722.50 | -2.60% | 16.90% | 28-Aug |
As you can see there has been a massive volatility in currencies over the last year. This is caused by countries fighting to devalue their currencies in order to be the cheapest currency to export more and have more income revenues. The problem is that the newly devalued currency for the citizens in that country now will buy less and less and as their salaries stay stagnate they become poorer.
USA is the problem
As you can see above The US dollar has become a safe haven as it is still by the trading class looked upon as a safe haven. The problem is that this is not the first time a massive increase in the US dollar versus other currencies. Lets take a look at a similar event happen before another historical event.
As you can see above around the times of market crashes the US Dollar increases in value as more and more people flee into it for “safety” while the downside will be huge when the crash comes.
Here are some of the causes of the current volatility from Charles Hugh Smith:
Five Interconnected Trends
At the risk of stating the obvious, let’s list the major trends that are already visible.
1. The China Story is Over
And I don’t mean the high growth forever fantasy tale, I mean the entire China narrative is over:
- That export-dependent China can seamlessly transition to a self-supporting consumer economy.
- That China can become a value story now that the growth story is done.
- That central planning will ably guide the Chinese economy through every rough patch.
- That corruption is being excised from the system.
- That the asset bubbles inflated by a quadrupling of debt from $7 trillion in 2007 to $28 trillion can all be deflated without harming the wealth effect or future debt expansion.
- That development-dependent local governments will effortlessly find new funding sources when land development slows.
- That workers displaced by declining exports and automation will quickly find high-paying employment elsewhere in the economy.
I could go on, but you get the point: the entire Story is over. (I explained why in a previous essay, Is China’s “Black Box” Economy About to Come Apart? )
This is entirely predictable. Every fast-growing economy starting with near-zero debt and huge untapped reserves of cheap labor experiences an explosive rise as the low-hanging fruit is plucked and the same abrupt stall and stagnation when the low-hanging fruit has all been harvested, leaving only the unavoidable results of debt-fueled speculation: an enormous overhang of bad debt, malinvestment (a.k.a. bridges to nowhere and ghost cities) and policies that seemed brilliant in the good old days that are now yielding negative returns.
2. The Emerging Market Story Is Also Done
Emerging currencies and markets have soared on the back of the China Story, as China’s insatiable demand for oil, iron ore, copper, soy beans, etc. drove global demand to unparalleled heights.
This demand pushed prices higher, which then pushed production (supply) higher, as the low cost of capital globally enabled marginal resources to be put into production with borrowed money.
Now that China’s demand has fallen off—by some accounts, China’s GDP is actually in negative territory, despite official claims that it’s still growing at 7% annually—commodity prices have crashed, taking the emerging markets’ stock and currency markets down. (Source)
Here is a chart of Doctor Copper, a bellwether for industrial and construction demand:

Here is Brazil’s stock market, which has declined 54% in the past 12 months:

These are catastrophic declines, and with China’s growth story over, there is absolutely nothing on the global horizon to push demand back up.
3. Diminishing Returns on Additional Debt
The simple truth is that expanding debt has fueled global growth. Though people identify China as the driver of global demand for commodities, China’s growth is debt-driven. As noted above, China quadrupled its officially tracked debt from $7 trillion in 2007 to $28 trillion as of mid-2014—an astonishing 282 percent of gross domestic product (GDP). If we add the estimated $5 trillion of shadow-banking system debt and another year’s expansion of borrowing, China’s total debt of $35+ trillion is in excess of 300% of GDP—levels associated with doomed to default states such as Greece and Spain.
While China has moved to open the debt spigot in recent days by lowering interest rates and reserve requirements, this doesn’t make over-indebted borrowers good credit risks or more empty high-rises productive investments.
Borrowed money that poured into ramping up production in emerging nations is now stranded as prices have plummeted, rendering marginal production intensely unprofitable.
In sum: greatly expanding debt boosted growth virtually everywhere after the Global Financial Meltdown of 2008-2009. That fix is a one-off: not even China can quadruple its $35+ trillion debt to $140 trillion to reignite growth.
Here is a sobering chart of global debt growth:

4. Limits on Deficit-Spending (Borrowed) Fiscal Stimulus
When the global economy rolled over into recession in 2008, governments borrowed money by selling sovereign bonds to fund increased state spending. In the U.S., federal borrowing soared to over $1 trillion per year as the government sought to replace declining private spending with public spending.
Governments around the world have continued to run large deficits, piling up immense debts since 2008. The global move to near-zero yields has enabled governments to support these monumental debt loads, but even at near-zero yields, the interest payments are non-trivial. These enormous sovereign debts place some limits on how much governments can borrow in the next global recession—a slowdown many think has already started.
Here is a chart of U.S. sovereign debt, which has almost doubled since 2008:

As noted on the chart: what structural inadequacies or problems did governments fix by borrowing gargantuan sums to fund state spending? The basic answer is: none. All the same structural problems facing governments in 2008 remain untouched in 2015. These include: over-indebtedness, bad debts that haven’t been written down, insolvent banks, soaring social spending as the worker-retiree ratio slips below 2-to-1, externalized environmental damage that has yet to be remediated, and so on.
5. Central Bank Stimulus (Quantitative Easing) as Social Policy Has Been Discredited
In the wake of the Global Financial Meltdown of 2008-2009, central banks launched monetary stimulus programs aimed at pumping money into the economy via bank lending. The stated goals of these stimulus programs were 1) boost employment (i.e. lower unemployment) and 2) generate enough inflation to stave off deflation, which is generally viewed as the cause of financial depressions.
While it can be argued that these unprecedented monetary stimulus programs achieved modest successes in terms of lowering unemployment and pushing inflation above the zero line, they also widened wealth and income inequality.
Even as these programs made modest dents in unemployment and deflation, they pushed asset valuations to the moon—assets largely owned by the few at the top of the wealth pyramid.

Here is a chart of selected developed economies’ income/wealth skew:

The widespread recognition that the benefits of central bank stimulus mostly flowed to the top of the pyramid places political limits on future central bank stimulus programs.
The 2008-09 Fixes Are No Longer Available
In summary, the fixes for the 2008-09 recession are no longer available in the same scale or effectiveness. Expanding debt to push up demand and investment, rising state deficit spending, massive monetary stimulus programs—all of these now face limitations. This means the central banks and states have very limited tools to reignite growth as global recession trims borrowing, investment, hiring, sales and profits.
The US have had a loose debt policy
The US have had a policy of deficit spending by government. The belief that by borrowing more money they can now pay down their debt with cheaper money. The problem is that they now have even more debt and need to print even more money to pay off that debt and they have entered into a never ending cycle of destructive behavior until people loose confidence in their worthless paper currency.
The US is bankrupt and many governments and banks around the world are bankrupt as well if they didn’t manage to get more debt to borrow to pay the interest on old debt they are done. They just accumulate debt while many governments heavily overspend.
Lets take a look at Government spending as a part of GDP to see how much of the total income of the country comes from government activity:
| Country | Tax burden % GDP | Govt. expend. % GDP |
|---|---|---|
| 276.7 | 139.7 | |
| 20.2 | 91.8 | |
| 24.4 | 66.7 | |
| 1.0 | 66.6 | |
| 12.0 | 65.3 | |
| 37.6 | 63.1 | |
| 48.1 | 57.6 | |
| 44.2 | 56.1 | |
| 43.4 | 55.1 | |
| 44.0 | 53.3 | |
| 31.2 | 51.9 | |
| 36.9 | 51.2 | |
| 44.5 | 51.2 | |
| 36.8 | 50.8 | |
| 42.1 | 50.5 | |
| 42.9 | 49.8 | |
| 38.7 | 49.8 | |
| 35.7 | 49.4 | |
| 31.3 | 49.4 | |
| 38.9 | 49.2 | |
| 16.8 | 49.0 | |
| 35.5 | 48.5 | |
| 27.6 | 48.1 | |
| 31.7 | 47.5 | |
| 36.0 | 47.3 | |
| 26.5 | 46.1 | |
| 38.0 | 45.6 | |
| 37.1 | 45.4 | |
| 35.2 | 45.2 | |
| 31.6 | 45.2 | |
| 33.1 | 45.1 | |
| 1.9 | 44.6 | |
| 32.6 | 44.6 | |
| 17.6 | 44.0 | |
| 43.2 | 43.9 | |
| 23.4 | 43.9 | |
| 24.2 | 43.8 | |
| 31.7 | 43.5 | |
| 35.3 | 43.3 | |
| 16.2 | 43.3 | |
| 32.6 | 42.5 | |
| 27.6 | 42.0 | |
| 34.4 | 42.0 | |
| 31.0 | 41.9 | |
| 37.1 | 41.8 | |
| 25.1 | 41.6 | |
| 34.6 | 40.9 | |
| 27.4 | 40.9 | |
| 10.0 | 40.4 | |
| 12.5 | 40.1 | |
| 14.3 | 40.0 |
As you can see at the top the 50% government as a part of GDP these countries are in economic turmoil as they cannot support their bloated government anymore. Greece, Denmark, France, Finland, Slovenia and Italy. These countries have so much government as they government has become unsustainable.
When a governments size hits over 50% of a countries size and private sector is 50% then the government who creates nothing of real value other than needing income from the private sector in form of taxes. The bigger the government becomes the more taxes you have to pay. We might see as high taxes as England saw in the 60’s and 70’s.
See this is what happens when you pay 95% taxes the Beatles even wrote a song about it called the Taxman:
What is coming in the weeks ahead?
I believe we will see even more volatility in the markets signalling a crash, but governments will do whatever it takes to intervene in order to have people trust their local currency.
The Plunge Protection Team in the US as an example went in during the crash last Monday.
Working Group on Financial Markets
The Working Group on Financial Markets (also, President’s Working Group on Financial Markets, the Working Group, and colloquially the Plunge Protection Team) was created by Executive Order 12631,[1] signed on March 18, 1988 by United StatesPresidentRonald Reagan.
As established by Executive Order 12631, the Working Group on Financial Markets has three Purposes and Functions.
(a) Recognizing the goals of enhancing the integrity, efficiency, orderliness, and competitiveness of our Nation’s financial markets and maintaining investor confidence, the Working Group shall identify and consider:
- (1) the major issues raised by the numerous studies on the events in the financial markets surrounding October 19, 1987*, and any of those recommendations that have the potential to achieve the goals noted above; and
- (2) the actions, including governmental actions under existing laws and regulations (such as policy coordination and contingency planning), that are appropriate to carry out these recommendations.
(b) The Working Group shall consult, as appropriate, with representatives of the various exchanges, clearinghouses, self-regulatory bodies, and with major market participants to determine private sector solutions wherever possible.
(c) The Working Group shall report to the President initially within 60 days (and periodically thereafter) on its progress and, if appropriate, its views on any recommended legislative changes.[1][2]
These teams of officials in many countries are working with hedge funds and pension funds with deep pockets and with the central banks to keep a market crash from happening.
This is just a centrally planned economy and the free market and capitalism that experts say is dead is non existent.
Also the recent jump back up in oil and commodity prices will be short lived. Many commodities are less manipulated and some of them show a more accurate measure of current economic conditions. Be prepared for sub $35 a barrel of crude oil in the coming weeks and months as the whole debt based monetary system is about to unravel and interest rates will not go up as central planners will finally say to the public there is nothing we can do.
Stock markets will start to tumble and more and probably see another downside of another 30-40% on many stock exchanges. The US dollar selloff might start as countries are desperate to rescue their economies by selling foreign reserves which mostly is US debt.
There will also be an unwinding of the fracking industry and over $10T in derivatives held by pension funds and investors will become worthless as the over-leveraged fracking industry will go bankrupt caused by under production cost oil prices.
Several big real estate bubbles will pop especially China’s, Canada and Norway’s as these countries continued to pump up real estate prices in 2008.
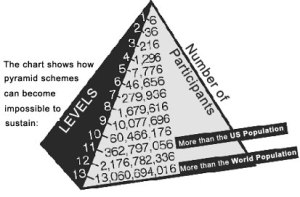
The end game is getting closer, but we might see another attempt by central planners to keep the ponzi scheme alive by propping up the markets and printing more money QE4 and keeping interest rates lower and closer to zero or negative.
John Sneisen
The Economic Truth
Non copyrighted

